Debugging X-Ray
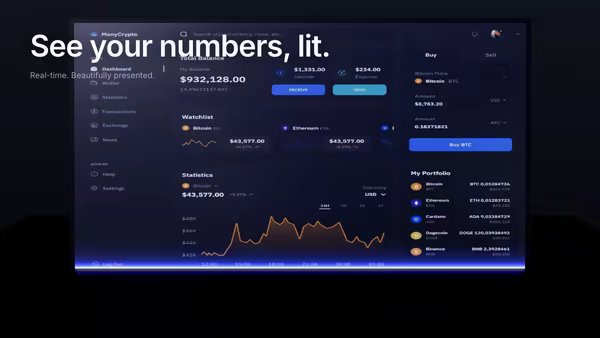
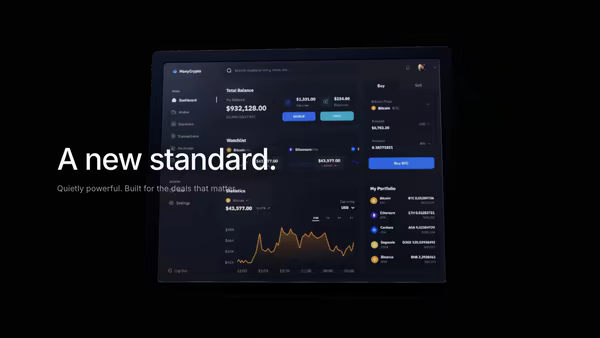
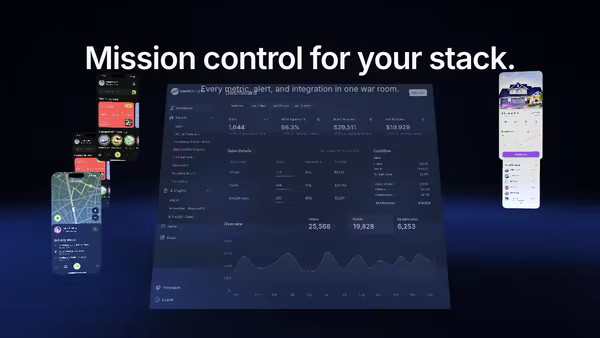
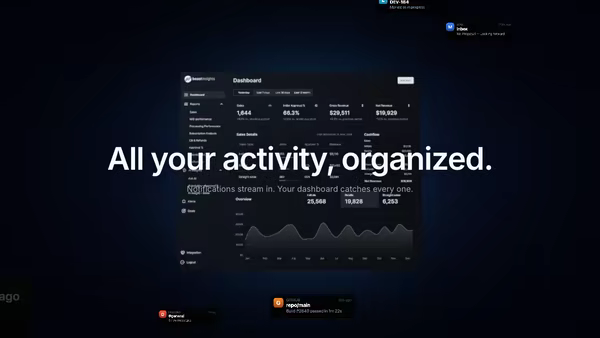
A polished product screenshot scanned by an animated x-ray band that reveals the underlying component structure as glowing devtools-style bboxes and accessibility outlines. Drag the pointer, or let it auto-sweep — exactly the feeling of opening the inspector on production.
Usage
import DebuggingXray from '@crazygl/hero-debugging-xray-hero';

export default function Hero() {
	return (
		<DebuggingXray
			heading="See every render, every leak, every layout shift."
			screenshot="https://crazygl.com/samples/screenshot-dashboard-dark.avif"
			scanMode="both"
			accentColor="#5cd5ff"
		/>
	);
}
Customise
- Content —
heading+subheading+ctaLabel/onCTAClick, two columns, or a custom node. - Screenshot —
screenshot(PNG/JPG/WebP/AVIF) plusscreenshotScale,screenshotX/Y,screenshotTiltto place it as a product card. - X-Ray scan —
scanMode(pointer / auto / both),scanSpeed,bandWidth,accentColor. - X-ray source —
xrayModeprocedural overlay or a customxrayImage(wireframe / blueprint, cover-fit aligned). - Overlay —
overlayStyle(bboxes / heatmap / both) andoverlayDensity. - Stage —
parallaxStrength,bgTop/bgBottom,transparentBackground.
The screenshot reads best with visible structure — dashboards, IDEs and admin UIs, whose cards, sidebars and tables give the bounding boxes real structure to discover.
Best for
- Observability and monitoring platforms (paint timing, Core Web Vitals, RUM).
- Devtools, inspector and frontend-performance products.
- Accessibility testing suites and engineering dashboards.
- AI-for-engineers pages where "see inside your app" is the pitch.
One command, zero config.
npm install @crazygl/hero-debugging-xray-heroImport once, drop it in.
The component takes the same props you see in the live customizer on the right — every default ships poster-quality.
import DebuggingXRay from '@crazygl/hero-debugging-xray-hero';

export default function Landing() {
  return (
    <DebuggingXRay />
  );
}SSR-safe by default.
The wrapper renders static HTML on the server and only initialises the canvas after hydration, so search engines see your copy.
// app/page.tsx — works in SSR-first frameworks (Next, Remix, Astro, etc.)
'use client';

import DebuggingXRay from '@crazygl/hero-debugging-xray-hero';

export default function Page() {
  return (
    <section>
      <DebuggingXRay
        heading="Say hi."
        subheading="Your new hero."
      />
      <article>
        <h2>Welcome</h2>
        <p>Your content keeps its own voice below the hero.</p>
      </article>
    </section>
  );
}